Consider the following scenario:
As a DNP-prepared nurse working in a rural clinic, you have a large population of patients with type 2 diabetes whose HbA1c levels are greater than 7% and body mass index (BMI) is over 30. You design a 9-month practice change project to impact these values.
Based on an exhaustive search and appraisal of research studies, you select an evidence-based intervention—diabetic self-management education (DSME)—to translate to your local rural clinic.
The evidence-based intervention includes exercise, healthy eating, and understanding the importance of regular blood glucose monitoring.
Before implementing the intervention, you retrieve aggregate data from 3, 6, and 9 months from medical records prior to the intervention being implemented. Data included HbA1c levels, BMIs, and numbers of patients with uncontrolled HbA1c. You also collected demographic data.
You collect the same data at 3, 6, and 9 months after implementation of the evidence-based intervention (DSME).
Pre-implementation and post-implementation data include the following.
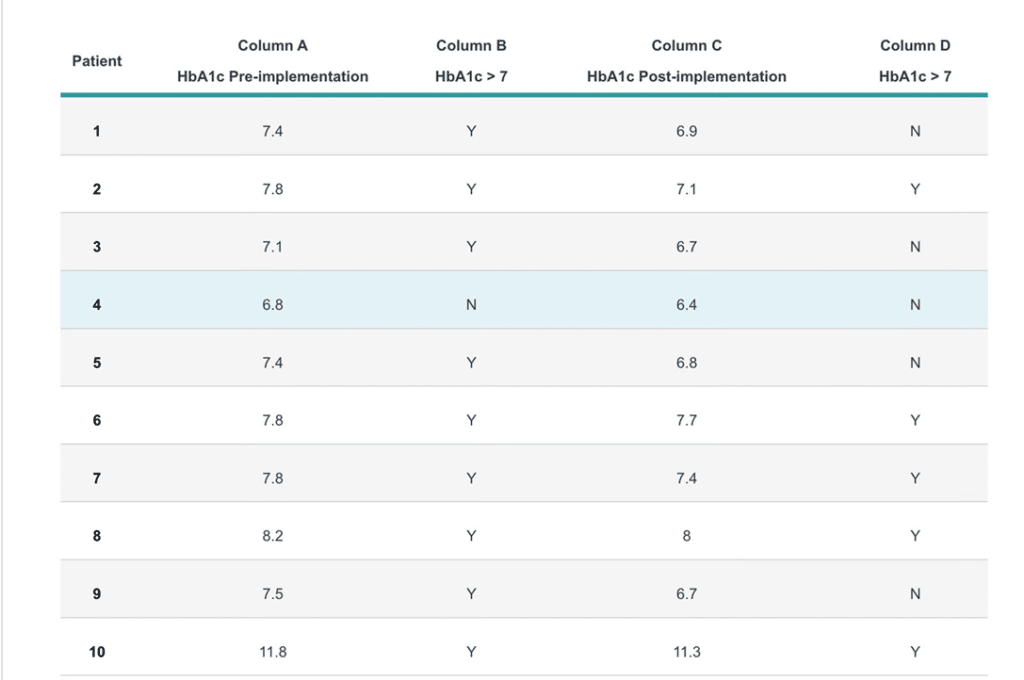
As a DNP-prepared nurse, you will analyze descriptive statistics, such as measures of central tendency and variability, to describe outcomes of a practice change project. Reflect upon this scenario and the data presented. What conclusions would you make at the end of this practice change project? What recommendations would you make to stakeholders for continuing the diabetes self-management education (DSME) program based on these results?
In order to respond to this discussion question, you will first need to complete the following calculations and consider responses to your analysis of the descriptive statistics.
- Perform the following calculations:
- Based on the data set provided, calculate the average percentage of patients with uncontrolled diabetes (HbA1c>7) both pre-implementation and post-implementation.
- Next, calculate the mean pre-implementation and post-implementation HbA1c values for patients involved in this practice change project.
- Now calculate the pre-implementation and post-implementation median score of HbA1c levels.
- Next, calculate the pre-implementation and post-implementation standard deviation of HbA1c levels of patients involved in the practice change project. The standard deviation will determine the spread of increase or decrease in HbA1c levels.
- Finally, calculate the pre-implementation and post-implementation range of HbA1c levels. If no outliers exist, the range will determine how close together HbA1c levels are in the patients involved.
- Based on your analysis of the descriptive statistics, what determinations related to the mean HbA1c levels following implementation of the evidence-based intervention can be made?
- As you reflect upon HbA1c levels, you observe that patient #10 HbA1c levels are an outlier. What does this do to your understanding of the data?
Do you need urgent help with this or a similar assignment? We got you. Simply place your order and leave the rest to our experts.